Water Quality Indicators

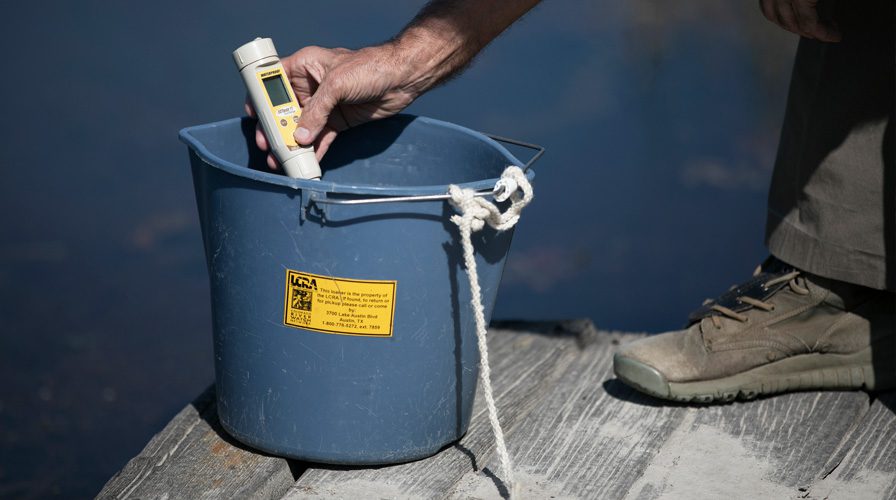
Colorado River Watch Network (CRWN) volunteers test for several key water quality indicators. The resulting water quality data provide baseline information, helps identify trends or changes in water quality, and aids investigations into problems such as nonpoint-source pollution and nutrient enrichment.
LCRA professional monitors conduct similar tests when they evaluate water quality. The testing provides data to LCRA, providing an early warning system for potential water pollution. For detailed information on water quality tests conducted by CRWN volunteers, see the CRWN Water Quality Monitoring Manual.
These are the key water-quality indicators:
- Dissolved oxygen (DO)
The DO test measures the amount of oxygen dissolved in the water. Oxygen is essential for both plants and animals, but high levels in water can be harmful to fish and other aquatic organisms. Nonpoint-source pollution can decrease the amount of dissolved oxygen in water, which can be harmful to fish and other aquatic organisms. The decomposition of leaf litter, grass clippings, sewage and runoff from feedlots decreases DO readings. Dissolved oxygen is measured in milligrams per liter (mg/L). Expected levels: 4.0 to 12.0 mg/L
- Water temperature
Aquatic organisms are dependent on certain temperature ranges for optimal health. Temperature affects many other parameters in water, including dissolved oxygen, types of plants and animals present and the susceptibility of organisms to parasites, pollution and disease. Causes of temperature change in water include weather conditions, shade and discharges from urban sources or groundwater inflows. Temperature is measured in degrees Celsius (°C). Seasonal trends: May to October: 22 to 35°C, November to April: 2 to 27°C
- pH
A pH test measures the alkalinity or acidity of water. A pH of 7 is neutral, below 7 is acidic and above 7 is basic or alkaline. Acid rain, from auto exhaust or other pollutants, causes a drop in the pH. Pollution from accidental spills, agricultural runoff and sewer overflows can also change the pH. Buffering capacity is water’s ability to resist changes in pH, and is critical to the survival of aquatic life. The limestone soils of Central Texas act to neutralize these acids and often result in a more basic pH. While young fish and insect larvae are sensitive to a low pH (acid), extreme values on either end of the scale can be lethal to most organisms. Expected levels: 6.5 to 9.0
- Escherichia coli (E. coli)
E. coli is a fecal coliform bacteria that comes from human and animal waste. The Environmental Protection Agency uses E. coli measurements to determine whether fresh water is safe for recreation. Disease-causing bacteria, viruses and protozoans may be present in water that has elevated levels of E. coli. Levels of E. coli can increase during flooding. E. coli is measured in number of colony forming units. The EPA water quality standard for E. coli bacteria is 394 colony forming units per 100 mL.
- Specific conductance
The specific conductance test measures the ability of water to pass an electrical current. Conductivity in water is affected by inorganic dissolved solids such as chloride, sulfate, sodium, calcium and others. Conductivity in streams and rivers is affected by the geology of the area through which the water flows. Streams that run through granite bedrock will have lower conductivity, and those that flow through limestone and clay will have higher conductivity. High conductance readings also can come from industrial pollution or urban runoff, such as water flowing from streets, buildings and parking lots. Extended dry periods and low flow conditions also contribute to higher conductance. Organic compounds, such as oil, do not conduct electrical current very well, so an oil spill tends to lower the conductivity of the water. Temperature also affects conductivity; warm water has a higher conductivity. Specific conductance is measured in microsiemens per centimeter (µS/cm). Expected levels: 300 to 700 µS/cm in most of the Colorado River watershed; higher near San Saba and the coast.
- Nitrates
Nitrogen is a nutrient necessary for growth of all living organisms. The CRWN nitrogen tests measure nitrate (NO3-N). Excessive amounts of nitrates increase algae growth. Algae can rob the water of dissolved oxygen and eventually kill fish and other aquatic life. Sources of nitrates may include human and animal wastes, industrial pollutants and nonpoint-source runoff from heavily fertilized croplands and lawns. Under certain conditions, high levels of nitrates (10 mg/L or more) in drinking water can be toxic to humans. High levels of nitrates in drinking water have been linked to serious illness and even death in infants. Nitrates are measured in milligrams per liter (mg/L). Expected levels: less than 1.0mg/L.
- Transparency
Transparency measures how far light can penetrate a body of water. Sunlight provides the energy for photosynthesis and determines the depth at which algae and other plants can grow, defining the ecological make-up of a water body. A change in water clarity may be noticed after heavy rains, as silt and debris can run off, causing the visibility to decrease. Transparency usually decreases in the summer when plankton, silt and organic matter are more likely to be prevalent. CRWN uses Secchi disks and transparency tubes to measure transparency.
- Visual tests
Monitors also record physical observations of water. Volunteers record water clarity and presence of plants and other aquatic life. They also may report the amount of rainfall received in the area.
To view data collected by our program, see CRWN Monitoring Sites and Data


Social Media